How Can I Prove That My Version B Will Be Better?
You’ve got enough visits to start an A/B testing experiment, but now you’re wondering how that calculation works exactly. How do I know if my Version B will end up being better than my Version A, with numbers.
The Three Factors
Let’s break A/B Testing apart into its three factors.
- Number of visits (sample size): The more visitors you have, the easier it is to see if there’s a difference, with confidence (see significance below).
- How well your version A is doing (baseline conversion rate): Right now, if you don’t change anything about your site, how well is the thing you’re tracking doing? That newsletter sign-up button, how often is it pressed compared to the total unique visits to that page? Is it 3%? Lower?
- How well you think you can improve it (percentage improvement): Do you think you can improve your baseline conversion rate (factor #2) by 20%? 30%? 50%?
There’s a useful relationship between factors #1 and #3. The more you think you can improve your page’s conversion, the fewer visitors you need to prove it.
But how do you prove your version B will be better?
A Significant Difference
Although you can’t prove version B will be better, you can be pretty sure there is a significant difference between the two versions.
That significance is measured by something called the p-value. A value of 0.05 for a p-value is what we’re normally looking for, and it means the following:
p-value
A p-value of 0.05 means that there’s only a 5% likelihood that the difference between version A and version B was caused by something other than the difference you introduced.
Measuring significance is about ruling out other factors much more than it is about proving a factor. To get a more precise version of that explanation, here’s a link to the Wikipedia article on the p-value to dig further.
To get a p-value of 0.05 (or lower, of course, the lower the better), you need to run the math. And that math takes into account the three factors in this way:
- Increases in the number of visits (sample size) reduces the p-value (gives you more confidence there’s a significant difference);
- A lower percentage for how well your version A is doing (baseline conversion rate) increases the p-value (adding uncertainty, because there are too few conversions to make our calculations from);
- Increases in how well you think you can improve it (percentage improvement) reduces the p-value (your improvement will be easier to demonstrate).
Calculating Whether Version B Will Bring A Significant Difference
Given those three factors, how do you calculate whether the percentage improvement will be significant?
For the details on how that calculation is done, here’s a link to an interactive notepad you can modify and see the calculations in action. Here’s how it looks after you follow that link:
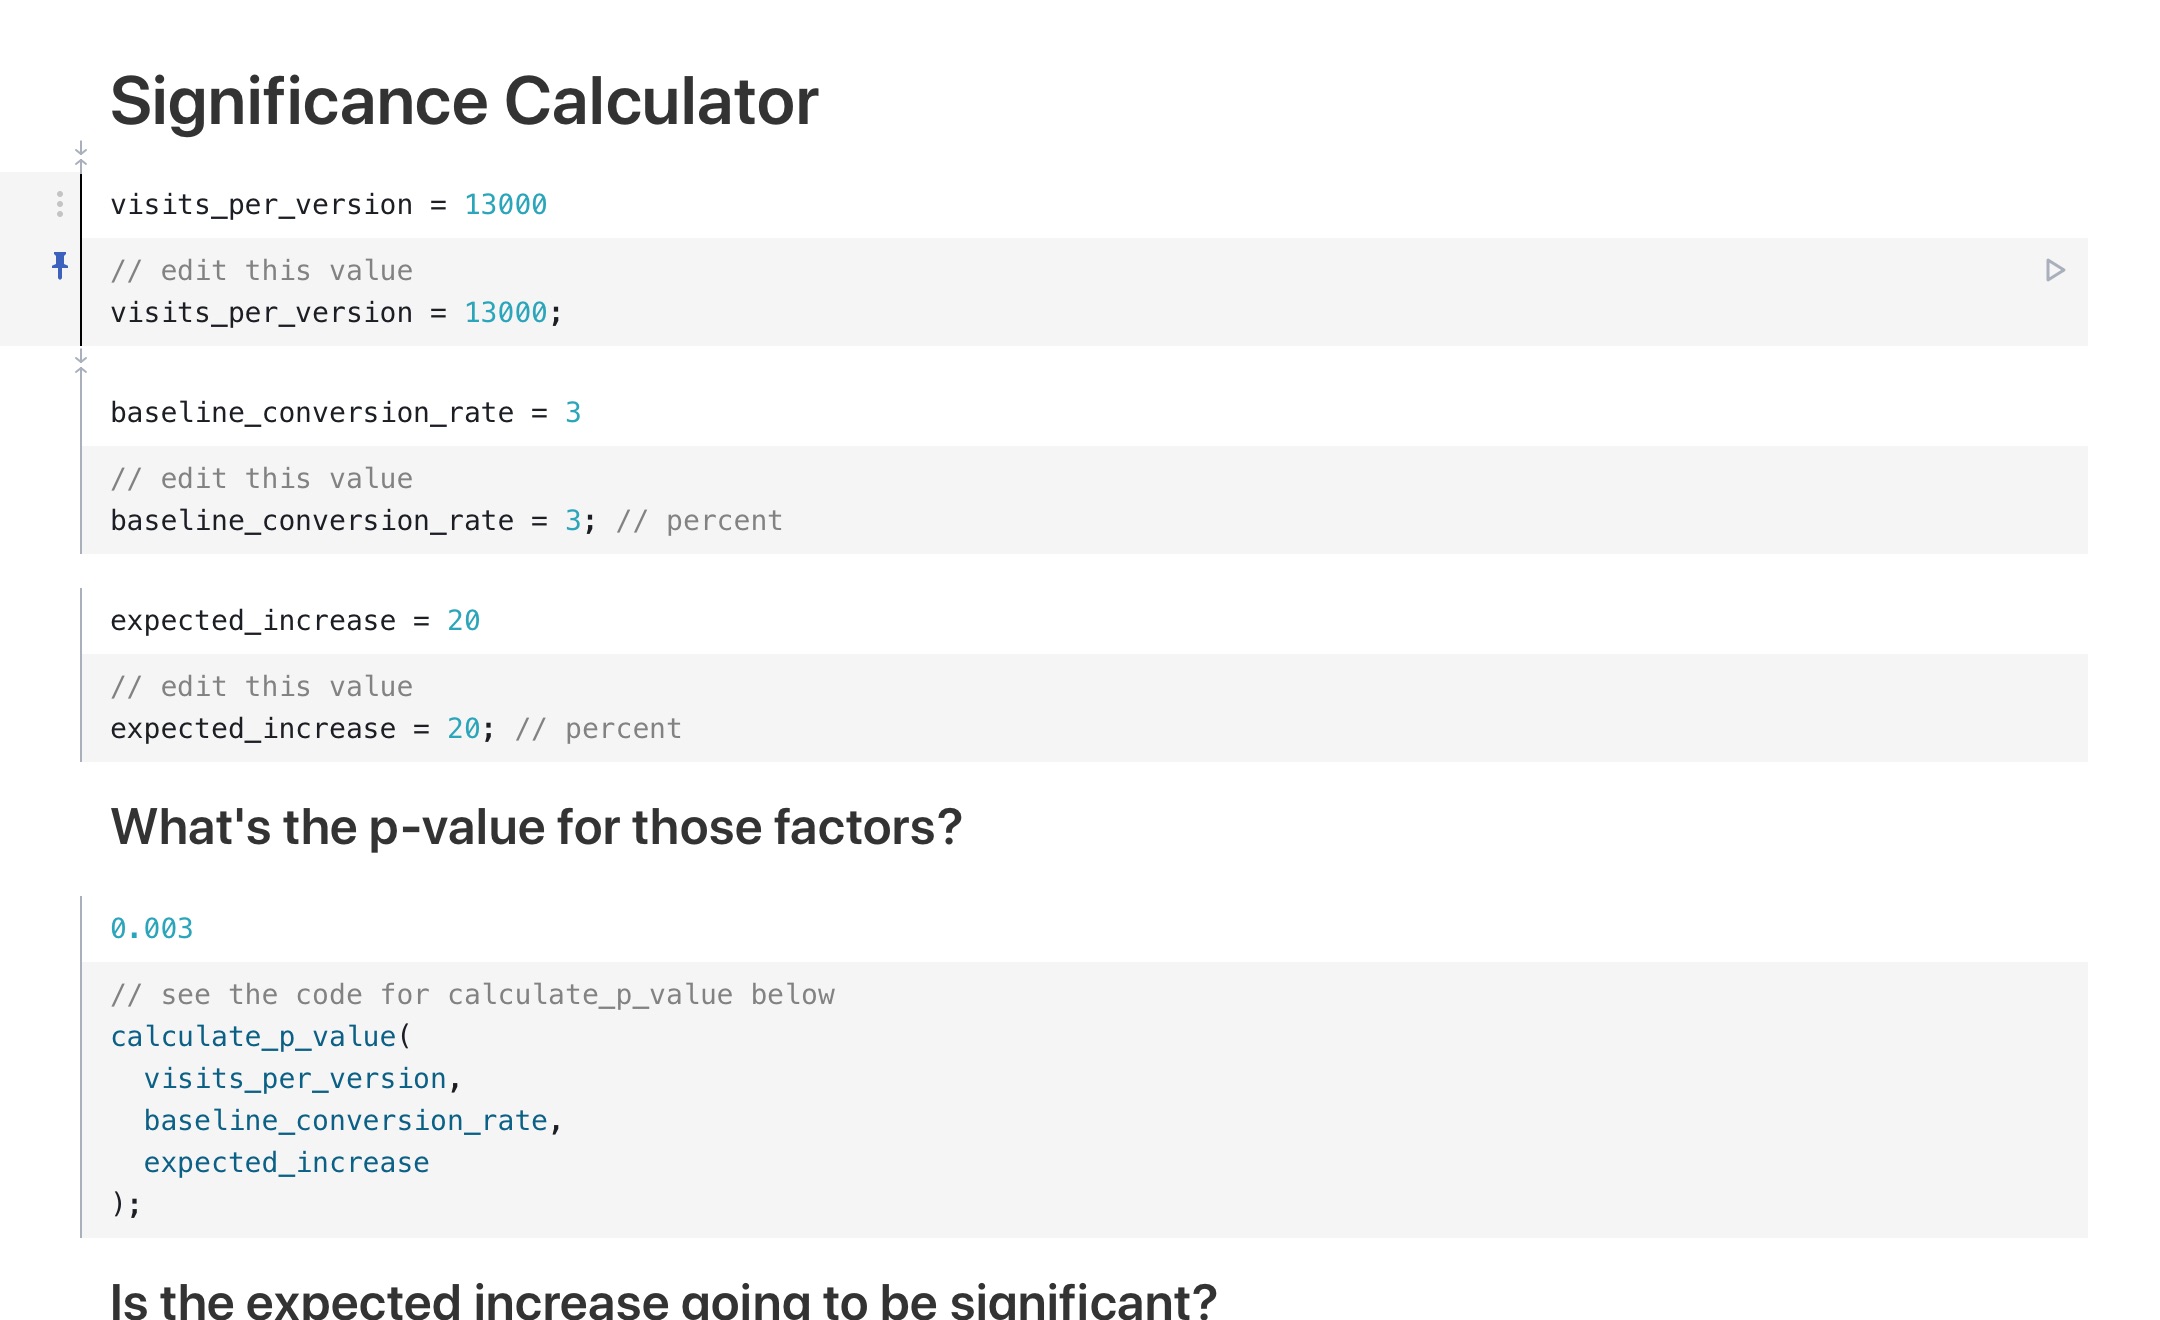
Note: The calculations used here will be a little different than the ones used in the previous article, namely because the previous article’s tool (Optimizely) derives its p-value calculations from data from their own service.
Next week, we’ll be answering the question: “How Do I Increase Conversion Rates Without Being a Jerk?”
Stay Sharp!
—
Pascal Laliberté
@pascallaliberte